Frequent glucose spikes ↑ insulin demand → worsens insulin resistance and liver fat over time
✅ Yes
Physical activity & muscle use
Active muscle burns glucose and improves insulin sensitivity; inactivity does the opposite
✅ Yes
Sleep (duration & quality)
Short/poor sleep raises cortisol and appetite, making the body more insulin-resistant
✅ Yes
Stress load (chronic stress)
Chronic stress hormones reduce insulin sensitivity; tends to drive comfort-eating
✅ Yes
Alcohol (amount & frequency)
Burden on the liver, worsens triglycerides & liver fat; sugary drinks add glucose spikes
✅ Yes
Body fat distribution (especially waist/visceral fat)
Visceral & liver fat drive insulin resistance; small, steady loss at the waist helps a lot
✅ Yes
Family history / genetics (e.g., parent with Type 2)
Raises baseline risk (e.g., beta-cell function, fat storage pattern), so lifestyle “levers” matter even more
❌ No
Ethnic background
Some groups (e.g., South Asian, African-Caribbean) have higher risk at lower BMI—earlier screening is wise
❌ No
Medical conditions & medications (e.g., steroids, some antipsychotics; PCOS, sleep apnoea)
Can increase insulin resistance or appetite; work with your clinician on risk-mitigation strategies
❌ No
Early-life factors (birthweight, early growth)
Programs later metabolism; you can still offset risk with activity, diet quality & sleep
❌ No
My own example: Family history + poor diet + no exercise
Mix of things under my direct control and genetics that i cannot change. Genetics set a higher baseline, but improving diet quality, daily movement, sleep and stress can significantly reduce insulin resistance and risk—despite family history.
Understanding Insulin Resistance: The First Step Toward Type 2 Diabetes
Most people have heard the term “insulin resistance”, but few really understand what it means — or how quietly it can develop over many years. It’s not something you catch overnight, and it doesn’t only happen to people who are overweight or unfit. In fact, insulin resistance is often the first stage on the long road to Type 2 diabetes — and the earlier you spot it, the easier it is to reverse.
🧬 What Is Insulin Resistance?
Insulin is a hormone produced by your pancreas that helps control the level of sugar (glucose) in your blood. Every time you eat — whether it’s a sandwich, fruit, or a fizzy drink — your blood sugar rises. Insulin’s job is to act like a key, unlocking your cells so that glucose can move from your bloodstream into the cells where it’s used for energy.
When everything is working normally, your body keeps blood sugar levels within a very tight range. But with insulin resistance, that balance starts to fail.
In this state, your muscle, fat, and liver cells stop responding properly to insulin’s signal. It’s as if the locks on your cells have become rusty. The pancreas reacts by producing more insulin to force the glucose through, but over time, the system becomes overworked and inefficient. Blood sugar begins to rise — even when insulin levels are high.
⚙️ How Do You Develop Insulin Resistance?
Insulin resistance doesn’t appear suddenly. It builds slowly — often over 10 to 15 years — as the result of lifestyle, diet, and genetic factors interacting over time.
Some of the main drivers include:
Excess calories over time – even small daily surpluses add up.
Lack of movement – the less your muscles are used, the less sensitive they become to insulin.
Sleep deprivation and chronic stress – both increase cortisol, which promotes insulin resistance.
Processed foods and hidden sugars – refined carbs, sugary drinks, fruit juices, “low-fat” snacks, sauces, and cereals create constant glucose spikes.
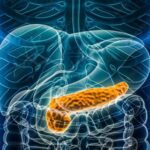
Visceral fat – the fat stored around your organs (especially the liver) is hormonally active and interferes with insulin signaling, even if you look slim on the outside.
Alcohol and late-night eating – both stress the liver and disrupt glucose control.
It’s worth repeating: you don’t need to be overweight to have insulin resistance. Many lean people develop it due to inactivity, poor diet quality, and genetics. Fat stored in the liver and pancreas — not just under the skin — plays a major role.
🩸 The Science Behind It
As your cells resist insulin, your pancreas pumps out more and more of it. For years, this can keep your blood sugar normal — which is why many people feel fine and have no symptoms. Eventually, the pancreas can’t keep up. Blood sugar starts to climb. This stage is called pre-diabetes — and without changes, it usually progresses to Type 2 diabetes.
You might notice:
Fatigue after meals
Difficulty losing weight
Increased hunger or cravings for carbs
A thickening waistline
Brain fog or afternoon energy crashes
These are often brushed off as “getting older” — but they’re early warning signs that insulin resistance may be developing.
🥦 How to Prevent (or Reverse) Insulin Resistance
The good news? It’s reversible. Even long-standing insulin resistance can be improved with consistent changes that help your body regain sensitivity to insulin.
Move your body daily Exercise is the single most powerful tool. Walking after meals, strength training, cycling — anything that contracts large muscle groups helps draw glucose into cells without needing as much insulin.
Cut back on processed carbs and sugars Reduce foods that cause sharp glucose spikes: white bread, pastries, crisps, sweets, fizzy drinks, fruit juice, and breakfast cereals. Focus on fibre-rich carbs (vegetables, beans, oats) and balanced meals with protein and healthy fats.
Mind your eating window Fasting or even spacing meals 4–5 hours apart gives your body a break from constant insulin spikes.
Sleep and stress Poor sleep and chronic stress make the body insulin resistant almost instantly. Prioritise consistent sleep and stress management (walking, mindfulness, time outdoors).
Maintain a healthy body composition It’s not about weight alone — reducing visceral fat around the waist and organs is key.
Limit alcohol Alcohol makes the liver focus on detoxifying rather than balancing glucose, worsening insulin sensitivity.
📊 The Bigger Picture
In the UK, it’s estimated that:
Around 13.6 million people are at risk of developing Type 2 diabetes (NHS, 2024).
More than 4.3 million are already diagnosed.
Another 850,000 are believed to have Type 2 but don’t yet know it.
Behind those numbers are millions more in the “insulin resistance” stage — seemingly fine, but on a trajectory that can lead to serious health complications unless addressed.
🌱 Final Thoughts
Insulin resistance isn’t a moral failing — it’s a biological response to the modern world: easy calories, less movement, disrupted sleep, and chronic stress. But understanding it gives you power.
Every walk, every home-cooked meal, every early night helps your cells become more insulin sensitive again and that’s the real beginning of remission — not medication, but metabolic repair.
From “Living Life” to Type 2 diabetes: how it really happens
Generally, people don’t just “suddenly” develop pre-diabetes. It’s not a bad week or a single takeaway that does the damage, no, it’s actually a slow drift over the years, consisting of small but significant events that all add up towards a life with Type 2.
A SLOW DRIFT : THIS IS WHAT MAKES IT HARD TO DETECT UNLESS YOU GO LOOKING!
Behind the scenes, your body is working harder and harder to keep blood sugar in the normal range… until one day the blood test says otherwise.
What follows is a general timeline of events that leads to the slow, mostly hidden decline in health and the rising prominence of Type 2 diabetes:
Year 0–3: life gets busier, movement tails off
School or uni sport ends; weekend football, rugby or hockey becomes ad-hoc; the gym bag gathers dust. Work ramps up, commuting eats time, family life needs your energy. You’re not sedentary on purpose—it just… happens.
Less muscle use means less glucose being burned day to day, so the same meals now push sugars a bit higher than they used to.
Year 1–5: convenience creeps into the diet
You still cook, but there’s more “grab-and-go”: breakfast cereals, granola, muffins; meal deals; sauces, dressings, and ready meals; Friday takeaways; more alcohol at weekends.
Hidden sugars creep in: sugary drinks and energy drinks, sweetened coffees, yoghurts, cereal bars, ketchup/BBQ sauce, and even “natural” options like fruit juice and smoothies—which count as free sugars just like table sugar and are limited in UK guidance to help protect health.
The NHS advises adults to keep free sugars to no more than 30 g per day; Bear in mind nearly a quarter of added sugars in the UK diet come from sugary drinks (a regular can of cola has ~35 g) so that’s it in one go!! (nhs.uk)
Year 2–8: “Not particularly overweight, thin even ? Don’t be fooled!!!”
You can look fine in a T-shirt and still be storing the wrong kind of fat. Visceral fat sits deep inside the abdomen around organs; liver fat (MASLD/NAFLD) accumulates inside the liver. You can’t pinch these.
They’re metabolically active and strongly linked to insulin resistance—the core problem that pushes people towards type 2 diabetes. The NHS and major clinics flag fatty liver as common and often silent; it’s tightly tied to weight, diet and activity patterns. (nhs.uk)
Year 4–10: the pancreas turns up the volume
As muscles and liver become less responsive to insulin, the pancreas compensates: it releases more insulin to keep blood glucose normal. This can go on quietly for many years.
Beta cells are the insulin-producing cells of the pancreas and research estimates insulin resistance and beta-cell strain precede type 2 by roughly a decade (and measurable beta-cell decline can be seen more than 10–12 years before diagnosis). Eventually, the system can’t fully compensate—fasting glucose and HbA1c start to climb into the pre-diabetes range. (NCBI).
Quick pancreas note (we’ll save the deep dive for a separate post):
When the body demands more and more insulin, those cells work overtime. Over years, output falters, especially if liver/muscle fat and inflammation persist—insulin resistance rises, insulin supply struggles.
Along the way: time-poor choices and missing knowledge
When you’re tired and pressed for time, ultra-processed foods and takeaways are easy wins. Labels are confusing; “no added sugar” doesn’t always mean low sugar (fruit concentrates still count as free sugar).
Many of us haven’t kept up with newer science—for example, how the gut microbiome interacts with metabolism and glucose control; or how sleep and stress alter appetite hormones and insulin sensitivity.
These aren’t moral failings—they’re predictable outcomes of modern life. The fix is usually small, repeatable changes, not perfection.
The blood test that finally catches it
Test
Normal
Pre-Diabetes
Diabetes
Notes
Fasting Plasma Glucose (FPG)
Below 5.6 mmol/L
5.6 – 6.9 mmol/L
≥ 7.0 mmol/L
After fasting ≥ 8 hours
Hemoglobin A1c (HbA1c)
Below 5.7%
5.7%-6.4%
>6.5%
~3-month average
How common is Type 2 diabetes in the UK right now?
Most people feel no symptoms—which is why the journey feels “sudden” when it’s not
Pre-diabetes (non-diabetic hyperglycaemia): Latest NHS England figures show 3.6 million people registered with a GP had pre-diabetic blood sugars in 2023, up 18% from 2022. The ONS estimates about 1 in 9 adults in England (≈ 5.1 million) met biochemical criteria for pre-diabetes over 2013–2019. (NHS England)
Diabetes overall and Type 2: Diabetes UK reports over 5 million people in the UK now live with diabetes (most of these are Type 2). Official surveillance shows Type 2 prevalence recorded in adults in England reached ~7.0% by March 2024, and the charity’s latest briefing says about 1 in 5 UK adults now live with diabetes or pre-diabetes combined (≈ 12 million people). (Diabetes UK)
Bottom line: pre-diabetes is common, grows over years, and is driven by insulin resistance—fueled by inactivity, high free-sugar intake (including juices/smoothies), and hidden visceral/liver fat you can’t necessarily see.
Turning the tide – practical advice to tackle pre-diabetes before Type 2 can take hold
Initially, the full impact of diabetes is some way off but starts with insulin resistance. Below are some examples of actions you can take to improve your health. You will notice it’s not new advice!
Move most days. You don’t need to recreate school-team training—brisk walking, short strength sessions, and getting back to something you enjoy (five-a-side, touch rugby, a couch-to-5k plan) make muscles soak up glucose again.
Cut free sugars. Swap sugary drinks/juices for water or sugar-free options; watch sauces, cereals, “healthy” snacks; aim for ≤ 30 g/day free sugars. (nhs.uk)
Protect the liver. Favour whole foods (protein + fibre + healthy fats), reduce alcohol binges, and chip away at waist size—liver fat usually improves with steady weight loss and better sleep. (nhs.uk)
Sleep & stress count. Both can worsen insulin resistance; small improvements help the pancreas.
Stay curious. Keep an eye on credible sources about gut microbiome and metabolic health; this field is moving fast.
If you’ve just been told you’re “borderline” or pre-diabetic, that’s not a verdict—it’s an early warning. The same long, slow path that got you here can be walked back with small, boring, consistent changes that work with your life.
📚 Sources
NHS England update on people at risk / pre-diabetes counts (2023). (NHS England)
You have pre-diabetes but what does that really mean and what will you do about it?
For some, it feels underwhelming: the seriousness doesn’t quite sink in. After all, plenty of people have Type 2, and there are drugs to manage it… right?
For others, it’s overwhelming: a flood of information, medical jargon and often gentle warnings that it’s serious — yet at the same time, you’re left unsure, confused, and uncertain what real, effective next steps look like.
Whichever feeling you might experience, after the initial diagnosis it’s easy to get lost in medical jargon and conflicting advice—especially advice on social media. Feeling unsure and somewhat confused is normal as is the desire for clarity in the best way to manage this problem. This site is here to cut through the noise, bring clarity and awareness to Type 2 management, giving you a practical head-start on your journey to better health.
For many if not most, time can pass without addressing the root causes of Type 2 but when the focus shifts to understanding and working on the underlying issues, the journey can become an exciting and motivating process. With the right approach, diabetes can be brought into remission, medications reduced or no longer needed, and a sense of control and well-being restored.
This site was created to share the kind of information* and insights that are often missing at the start of the journey, and to provide a place for people to share their own experiences. The aim is simple: to help make the path to better health clearer, easier, and faster for anyone living with Type 2.
Hearing you have pre-diabetes or even full Type 2 diabetes can trigger two very different reactions:
For some, it feels underwhelming: the seriousness doesn’t quite sink in. After all, plenty of people have Type 2, and there are drugs to manage it… right?
For others, it’s overwhelming: a flood of information, medical jargon and often gentle warnings that it’s serious — yet at the same time, you’re left unsure, confused, and uncertain what real, effective next steps look like.
Whichever feeling you might experience, after the initial diagnosis it’s easy to get lost in medical jargon and conflicting advice—especially advice on social media. Feeling unsure and somewhat confused is normal as is the desire for clarity in the best way to manage this problem. This site is here to cut through the noise, bring clarity and awareness to Type 2 management, giving you a practical head-start on your journey to better health.
For many if not most, time can pass without addressing the root causes of Type 2 but when the focus shifts to understanding and working on the underlying issues, the journey can become an exciting and motivating process. With the right approach, diabetes can be brought into remission, medications reduced or no longer needed, and a sense of control and well-being restored.
This site was created to share the kind of information* and insights that are often missing at the start of the journey, and to provide a place for people to share their own experiences. The aim is simple: to help make the path to better health clearer, easier, and faster for anyone living with Type 2.